Day 32

Math 216: Statistical Thinking

Bastola

Understanding Type II Errors in Hypothesis Testing

  • Type I Error (\(\alpha\)): Rejecting the null hypothesis \(H_0\) when it is true. The probability of making a Type I error is controlled by the rejection region.

  • Type II Error (\(\beta\)): Accepting the null hypothesis \(H_0\) when it is false. Unlike \(\alpha\), \(\beta\) is not as easily controllable and varies with the true value of the parameter being tested against \(H_0\).


Error Types Table

Error Types and their Probabilities
Decision / Null Hypothesis \(H_0\) True \(H_0\) False
Fail to Reject \(H_0\) Correct Inference (True Negative) Probability = 1 - \(\alpha\) Type II Error (False Negative) Probability = \(\beta\)
Reject \(H_0\) Type I Error (False Positive) Probability = \(\alpha\) Correct Inference (True Positive) Probability = 1 - \(\beta\)

Example Hypothesis Setup

  • Null Hypothesis (\(H_0\)): \(\mu = 2400\)

  • Alternative Hypothesis (\(H_a\)): \(\mu > 2400\)

  • Test Statistic: \[ z = \frac{\bar{x} - 2400}{\sigma / \sqrt{n}} \]

  • Suppose \(\sigma_{\bar{x}} = 28.267\) and \(\bar{x} \sim N(\mu, 28.267)\).

  • Rejection region for \(\alpha = 0.05\) is \(z > 1.645\).

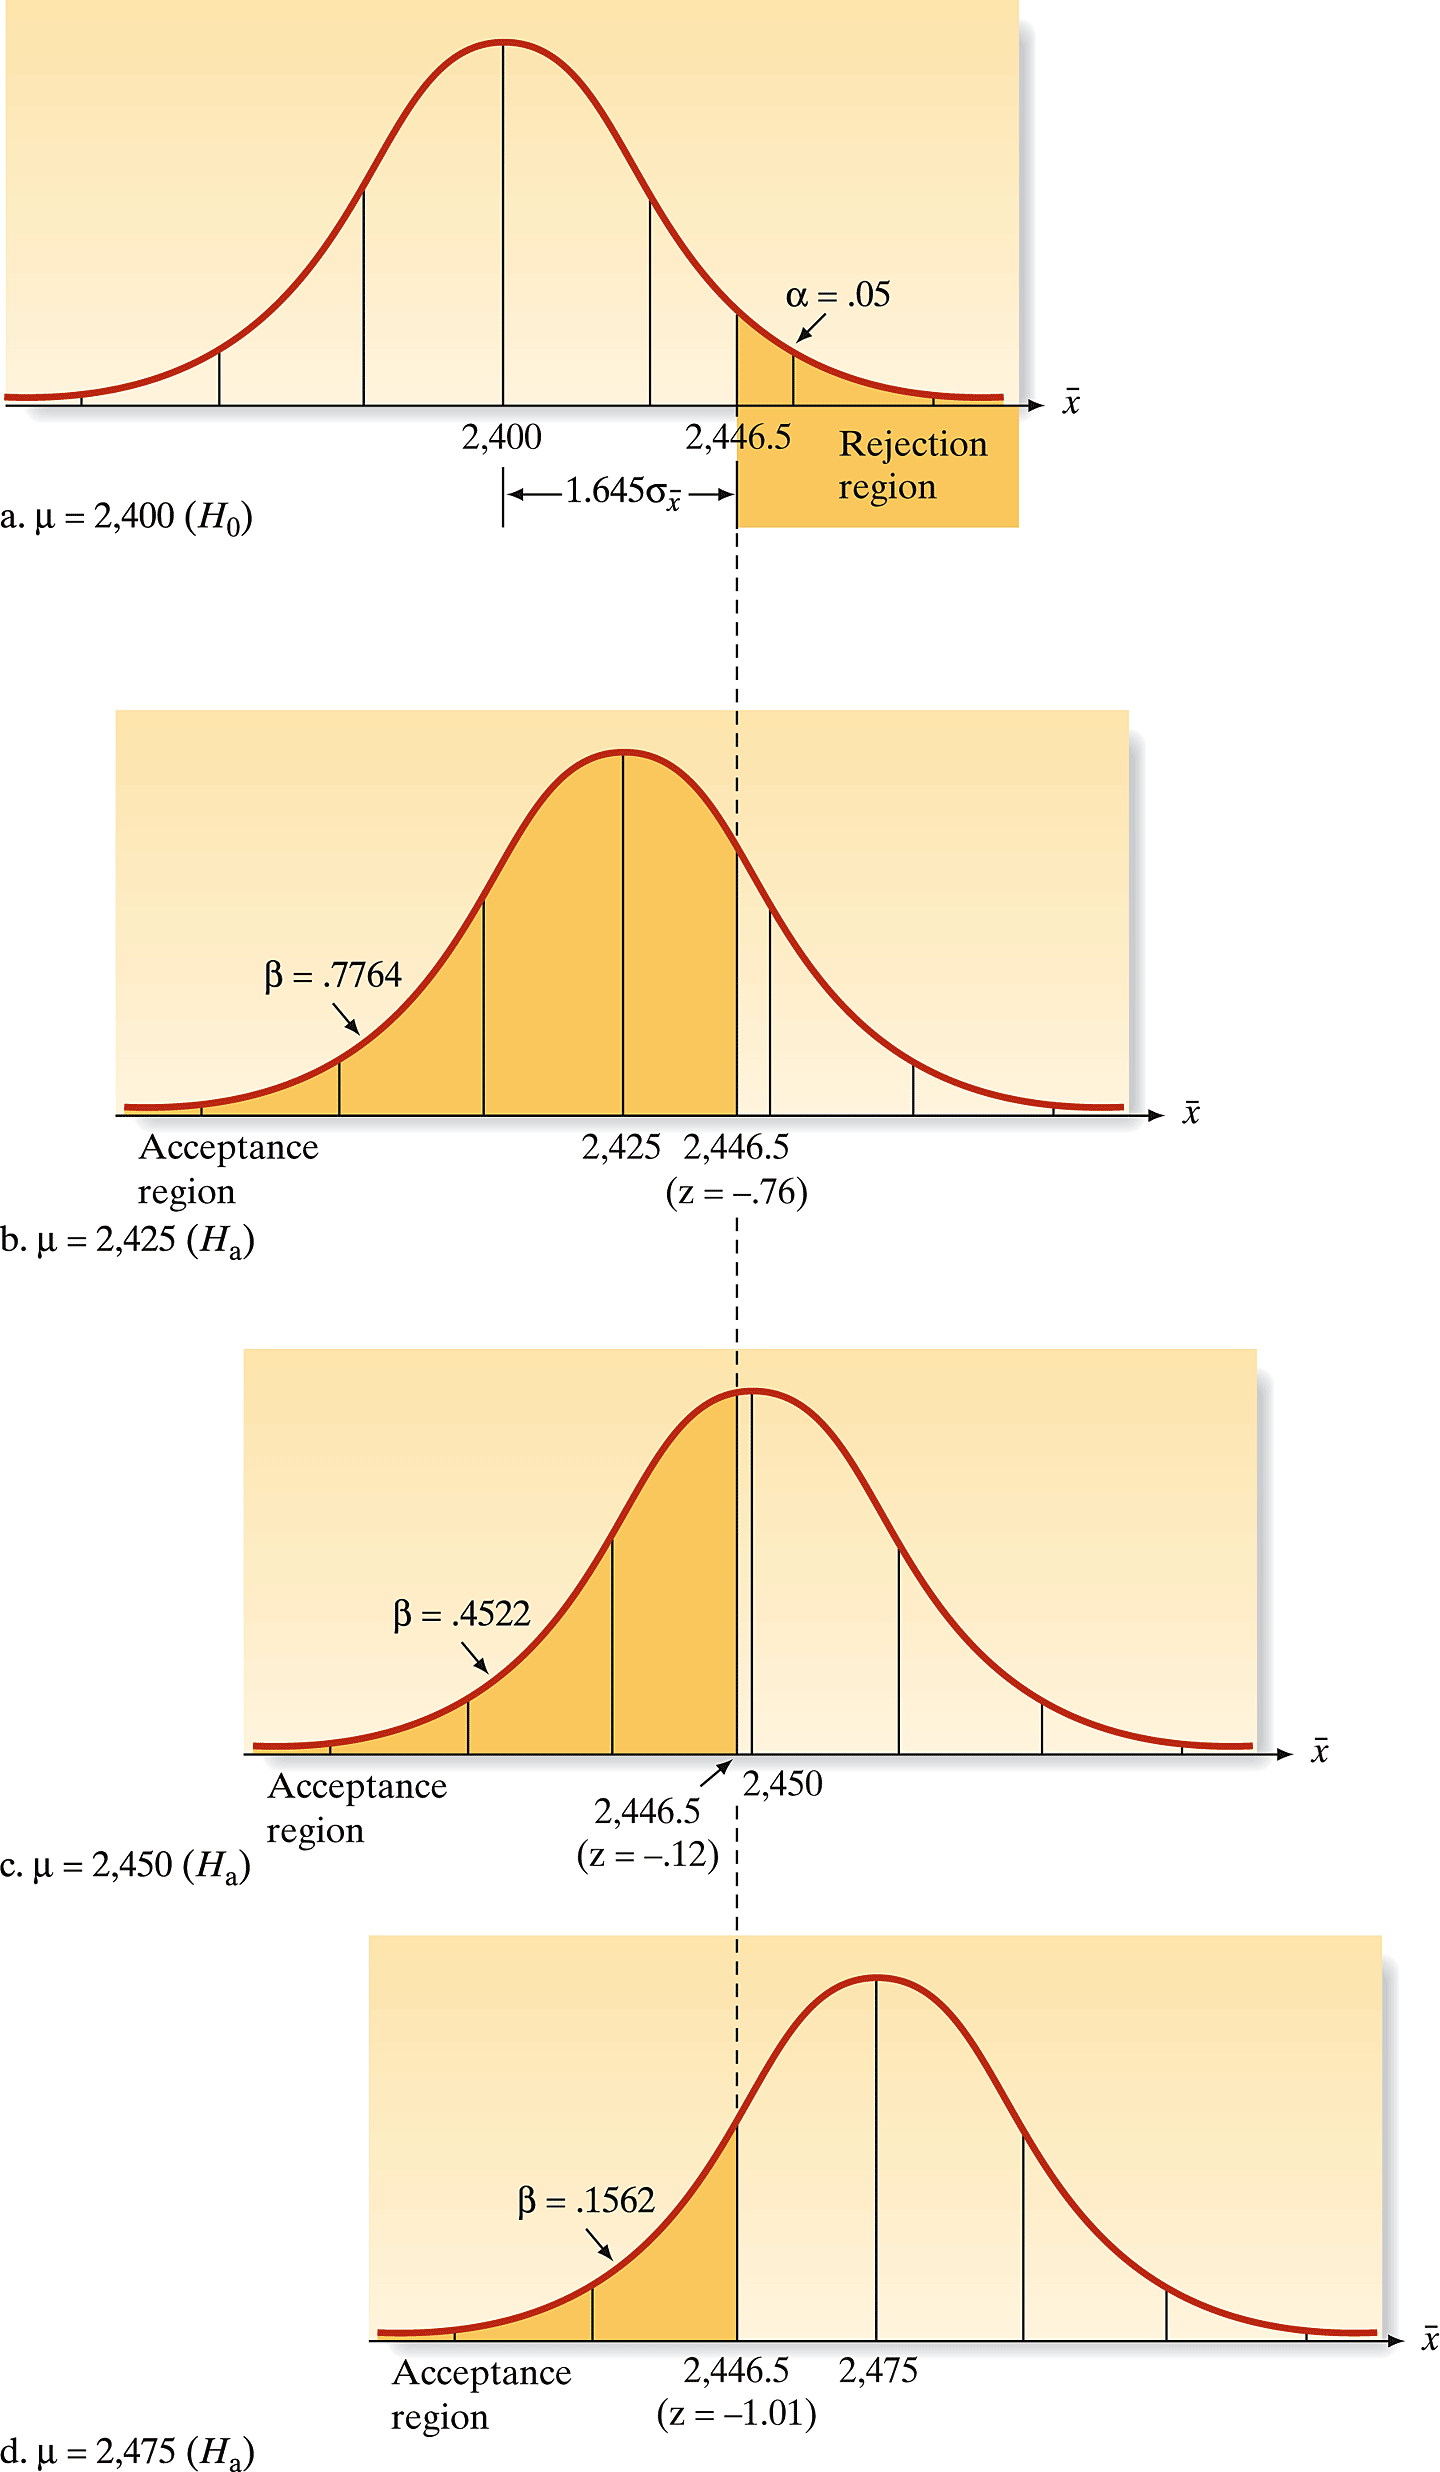
Visualization of the Rejection Region

The area in the rejection region under the null distribution (assuming \(H_0\) is true) is 0.05. This area represents \(\alpha\), the probability of rejecting \(H_0\) when it is in fact true.

  • The figures illustrate \(\beta\) for \(\mu = 2425, 2450, 2475\).
  • As \(\mu\) increases, \(\beta\) decreases, reflecting a lower risk of incorrectly accepting \(H_0\) as the true mean strength moves farther from \(2400\).

Calculating \(\beta\) for Different \(\mu\) Values

  • The probability of a Type II error, \(\beta\), is defined under the assumption that the null hypothesis is false.
  • \(\beta\) is calculated for each \(\mu > 2400\), reflecting the risk of accepting \(H_0\) when it is false.
    • For \(\mu = 2425\), we find \(\beta\) as the area under the curve to the left of \(\bar{x} = 2446.5\):

\[ \beta = \operatorname{Prob}\left[\bar{x} < 2446.5 \mid \mu = 2425\right] = 0.7764 \]

The Power of the Test

  • The power of a test is the probability that the test correctly rejects \(H_0\) for a specific \(\mu\) in \(H_a\).
    • Calculated as \(1 - \beta\), the power increases as \(\beta\) decreases.
  • Understanding \(\beta\) and the power of a test is crucial for assessing the effectiveness of hypothesis tests, especially when the true parameter differs significantly from the null hypothesis value.