Activity 33
MATH 216: Statistical Thinking
Activity 1: Chi-Square statistic
Calculate the Chi-Square statistic for the observed vs. expected frequencies below:
| Category | Observed | Expected |
|---|---|---|
| A | 30 | 25 |
| B | 20 | 25 |
| C | 50 | 50 |
Activity 2: Data Exploration
Prompt:
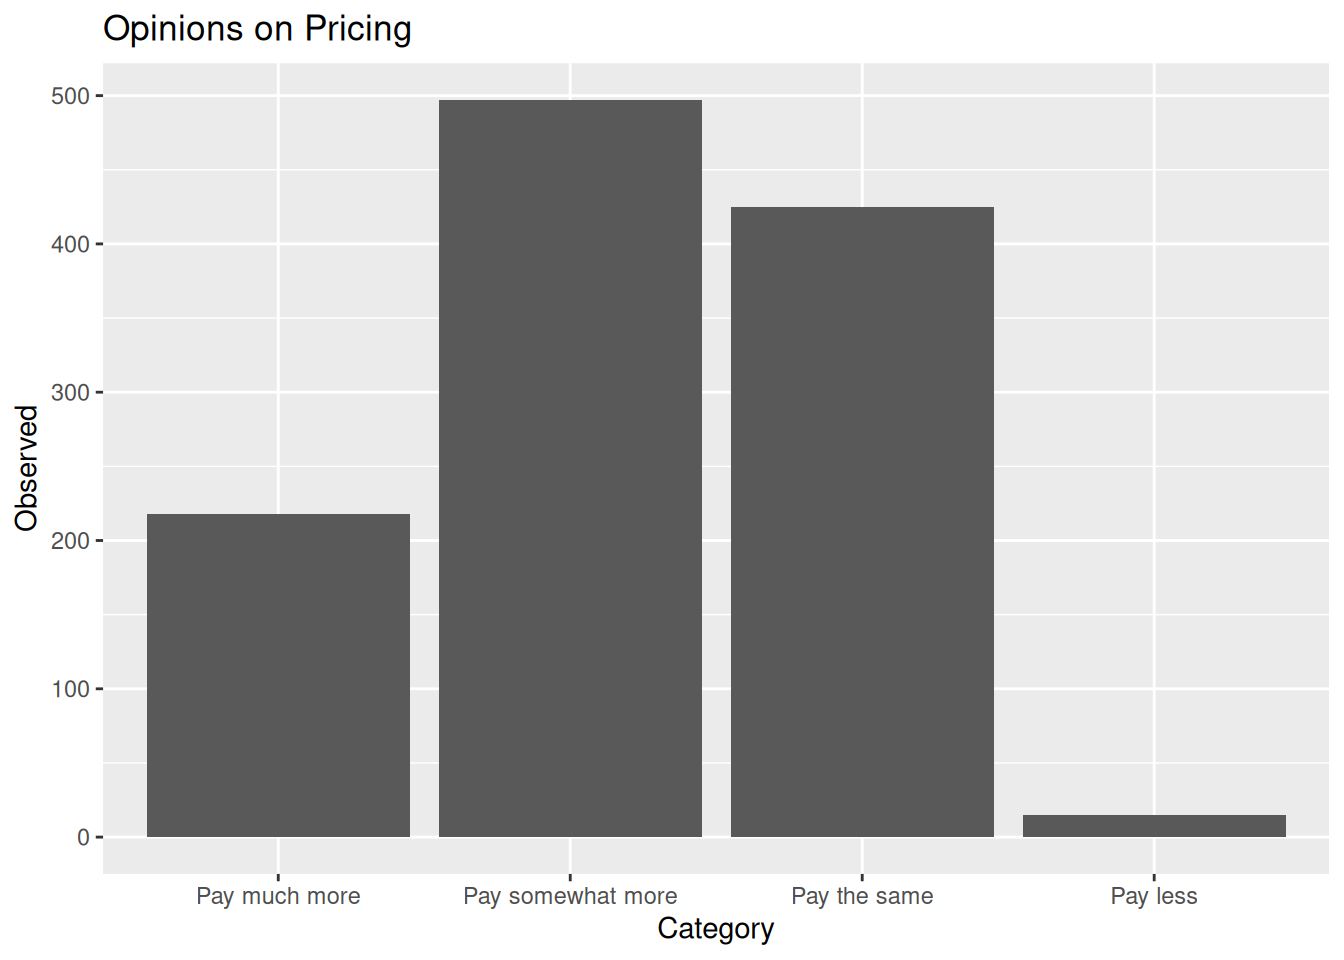
Visualize the ‘Opinions on Pricing’ dataset in RStudio and interpret the distribution:
| Category | Observed |
|---|---|
| Pay much more | 218 |
| Pay somewhat more | 497 |
| Pay the same | 425 |
| Pay less | 15 |
Activity 3: Group Analysis
Test if vaccination status and flu status are associated using the data below:
| Flu | No Flu | |
|---|---|---|
| Vaccinated | 24 | 289 |
| Unvaccinated | 9 | 100 |
| Partially | 13 | 565 |
    Pearson's Chi-squared test

data:  flu_data
X-squared = 17.313, df = 2, p-value = 0.000174
Activity 4: Case Study
A STEM program has 200 females and 300 males. Test if this deviates from the expected 50:50 ratio (\(\alpha = 0.05\)).
Activity 5: Tax Poll Analysis
Test if current tax opinions (Observed: 218, 497, 425, 15) differ from past percentages (18.5%, 39.2%, 41.2%, 1.1%) (\(n = 1155\)).