Activity 1: Quiz
Question: “Given the following contingency table, what is the expected count for the cell (Flu, One Shot) if the null hypothesis of independence is true?”
| Flu |
24 |
9 |
13 |
46 |
| No Flu |
289 |
100 |
565 |
954 |
| Total |
313 |
109 |
578 |
1000 |
Options:
Activity 2: Data Exploration
- Load the Data: Use RStudio to load the dataset provided below.
- Create a Contingency Table: Generate a contingency table using the
table() function.
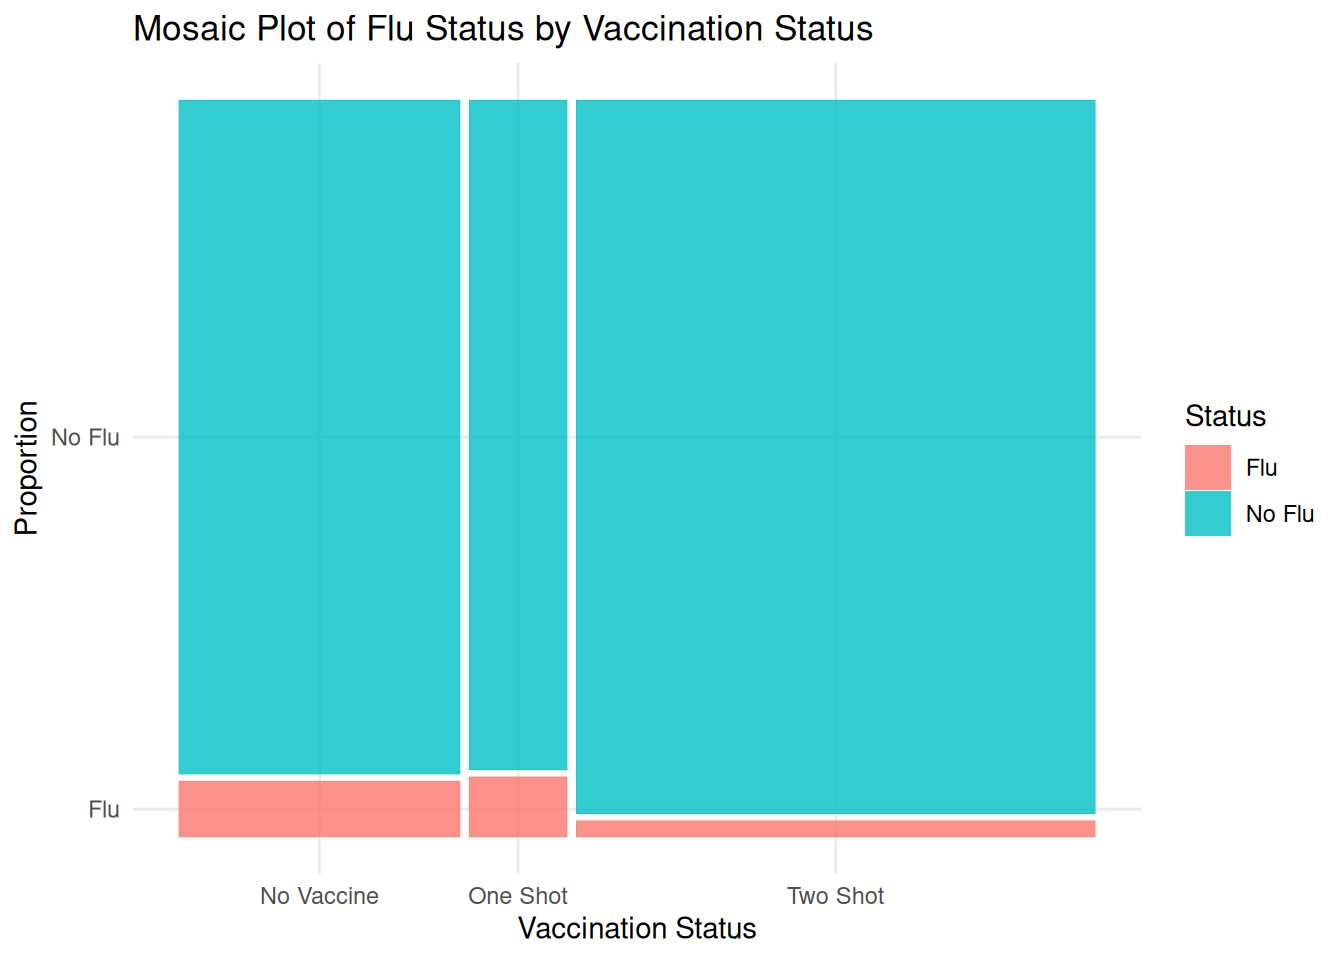
- Visualize the Data: Create a bar plot or mosaic plot to visualize the relationship between the variables.
Dataset:
| flu |
24 |
9 |
13 |
46 |
| no_flu |
289 |
100 |
565 |
954 |
| Sum |
313 |
109 |
578 |
1000 |
    Pearson's Chi-squared test

data:  tab1
X-squared = 17.313, df = 2, p-value = 0.000174
       No Vaccine One Shot Two Shot
flu        14.398    5.014   26.588
no_flu    298.602  103.986  551.412
Activity 3: Group Activities with Real Data
- Analyze the Data: Use the provided dataset to perform a Chi-Square test for independence.
- Interpret the Results: Discuss the results of the Chi-Square test. What does the p-value tell you about the relationship between the variables?
| strong |
8 |
10 |
12 |
30 |
| moderate |
12 |
17 |
6 |
35 |
| weak |
10 |
13 |
12 |
35 |
| Sum |
30 |
40 |
30 |
100 |
    Pearson's Chi-squared test

data:  tab2
X-squared = 4.5397, df = 4, p-value = 0.3379
          Republican Democrat Independent
strong           9.0       12         9.0
moderate        10.5       14        10.5
weak            10.5       14        10.5